
Description:
The Power, Privilege, and the Purse project was a two month exhibition that was taught to inform students on the importance of societal inequalities within our nation. Topics included, gender inequality, youth imprisonment etc. As a collaborative humanities class, the students were assigned jobs ranging from media teams (who take pictures and are in charge of the social media related to our project) to panelists (who are the students that discuss and speak on inequalities in our societies.) The students also had many lessons and talks about different inequalities such as, gender inequality and even watched a video on America's current wage gap The students also created position papers discussing our opinion on an inequality supported by data and more importantly what the students pointed out in the data. As a math class, the students did many lessons describing the wage gap, and most importantly, developing an understanding on basic financial topics such as, budgeting, taxes, investments, stocks, and debt. The students also learned about exponential growth and using that understanding to understand compounding interest. The students also had lessons on logarithms and how they are the inverse of exponents. The students also created info graphics either pertaining to their position paper or another topic of their choice. This info graphic was important to allow students to learn how to show information with graphs, and visuals.
My Process:
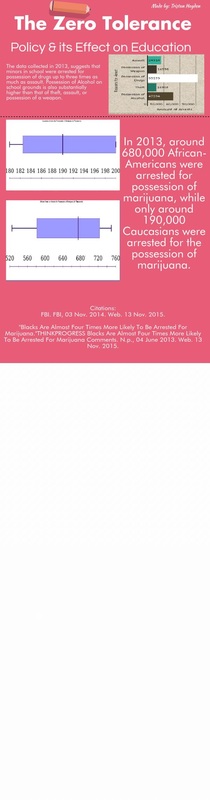
As a panelist within this project, my experience was very notable and I learned a lot about the school to prison pipeline. I decided to focus primarily on the zero tolerance policy which suspends, expels, and arrests students for trivial matters that could be dealt with within school. I created a position paper on the zero tolerance policy, which gave me an opinion, tons of data, and multiple stories to cover when I went to write my opening statement. When writing my opening statement, I realized that a lot of the data on my position paper wasn't strong, so I decided to do further research, until I was satisfied with the data I had collected. I also had to re-run through the symposium multiple times in order to stay within the time boundaries and work on my pronunciation with words. In math class, I created multiple products. I created a financial plan, which wasn't really relevant to the symposium, but still taught me about budgeting. I chose the job marketing specialist because I wanted to have an occupation that was related to business. Once I chose the job, I looked at the average salary and then used that salary to see what I could afford on a budget. When creating my info graphic, I wanted to relate it to my opening statement because I already had a ton of statistics on the topic and could create a great info graphic using that info. I used math when learning about compound interest and how that could affect someone's money. I also used math when learning about logarithmic functions, exponential functions, and different rates of growth. A challenge I faced was formatting my info graphic the way that it had to be because my info graphic was a runner up to being chosen to be printed, but I wasn't able to format it the way it was supposed to in time for the exhibition. I really enjoyed being part of the panel because I really feel like being a panelist put me in a position where I really got to experience the symposium.
Info graphic:
The Power, Privilege, and the Purse project was a two month exhibition that was taught to inform students on the importance of societal inequalities within our nation. Topics included, gender inequality, youth imprisonment etc. As a collaborative humanities class, the students were assigned jobs ranging from media teams (who take pictures and are in charge of the social media related to our project) to panelists (who are the students that discuss and speak on inequalities in our societies.) The students also had many lessons and talks about different inequalities such as, gender inequality and even watched a video on America's current wage gap The students also created position papers discussing our opinion on an inequality supported by data and more importantly what the students pointed out in the data. As a math class, the students did many lessons describing the wage gap, and most importantly, developing an understanding on basic financial topics such as, budgeting, taxes, investments, stocks, and debt. The students also learned about exponential growth and using that understanding to understand compounding interest. The students also had lessons on logarithms and how they are the inverse of exponents. The students also created info graphics either pertaining to their position paper or another topic of their choice. This info graphic was important to allow students to learn how to show information with graphs, and visuals.
My Process:
As a panelist within this project, my experience was very notable and I learned a lot about the school to prison pipeline. I decided to focus primarily on the zero tolerance policy which suspends, expels, and arrests students for trivial matters that could be dealt with within school. I created a position paper on the zero tolerance policy, which gave me an opinion, tons of data, and multiple stories to cover when I went to write my opening statement. When writing my opening statement, I realized that a lot of the data on my position paper wasn't strong, so I decided to do further research, until I was satisfied with the data I had collected. I also had to re-run through the symposium multiple times in order to stay within the time boundaries and work on my pronunciation with words. In math class, I created multiple products. I created a financial plan, which wasn't really relevant to the symposium, but still taught me about budgeting. I chose the job marketing specialist because I wanted to have an occupation that was related to business. Once I chose the job, I looked at the average salary and then used that salary to see what I could afford on a budget. When creating my info graphic, I wanted to relate it to my opening statement because I already had a ton of statistics on the topic and could create a great info graphic using that info. I used math when learning about compound interest and how that could affect someone's money. I also used math when learning about logarithmic functions, exponential functions, and different rates of growth. A challenge I faced was formatting my info graphic the way that it had to be because my info graphic was a runner up to being chosen to be printed, but I wasn't able to format it the way it was supposed to in time for the exhibition. I really enjoyed being part of the panel because I really feel like being a panelist put me in a position where I really got to experience the symposium.
Info graphic:
Deeper Learning:
I learned that it is extremely easy to become poor if you don't plan for the future or your parents fail to plan for your future. I also learned a lot about the student debt and how expensive it truly is. I also learned about investments, which I am extremely curious about and plan on doing in my near future. I also opened a savings account in the past month which I feel is now a necessity to have no matter your financial status based on what I learned through this project. I used mathematics in order to create a graph using a compounding interest formula to see how much I would save per year if I were to put a certain amount of money into savings every month. I definitely learn that wealth accumulates over time and there isn't a short term way of accumulating wealth unless you have a high paying job or win the lottery. During the project I also taught the concept of logarithms which are the inverse of exponents. We can use logarithms in order to simplify statistics or even in biology.
The statistical problem solving process is split into multiple steps.
I. Ask a question of interest
II. Design and implement a plan to collect data
III. Analyze data using graphs and numerical summaries
IV. Interpret results
I used these steps in order to create my info graphic and other graphs I created to benefit my opening statement for the symposium. I definitely did not know that African-American students are being arrested up to six times more than their white peers in some areas. This statistic blew my mind and I still can't believe inequities like this happen in our society today. I used these statistics in order to strengthen my opening statement because people were shocked when they heard these staggering statistics that oddly made sense based on all the media seen nationwide but were still shocking.
Mind the Gap Exhibition:
During the exhibition I was very calm actually and helped a lot with the setup since I got there a bit early as a panelist. I felt as if I was working at my stations very efficiently and stayed on task most of the time. I also tested the microphone one time! When it was my time to be the panelist at my panel, I was surprisingly very calm and actually confident in what I was going to say. After all, I wanted to make sure that the audience had an engaging panel. I grew as a person because I participate a lot more in class and get more engaged with projects than in previous years. I am really trying to step up my school engagement because I actually really enjoy school.
