
For this project in Math, we had to choose an image that represents us, or has a big impact in our own lives. We chose an image and then turned curves into straight lines making them able to be put on a (x,y) axis. Putting them on an axis was very important since we could possibly have other people try and create our pictures through a Cartesian plane. For one of our requirements was also implementing art into a separate picture to make sure it was aesthetically pleasing and quality work.
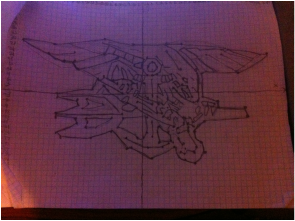
Now to explain my work and what I did to make it look good and beautiful work. I decided to choose a Navy SEAL Trident as this is very important to me and it is the only job I want to do in my life. The trident is awarded to Navy SEAL's who pass the required training and get onto the SEAL teams. This is definitely my overall life goal. After I chose the image I had to draw it out onto graph paper with line segments which eventually turned into a coordinate plane. The (x,y) value of the graph was solely depended on how complex your picture is and how well it fit the scale. This also has to tie into aspect ratio since if you didn't get a correct aspect ratio your picture would either look too wide or too tall, or just distorted in general. I am going to explain how GeoGebra works and how it was used to create our project. The spreadsheet view was very important given the fact that that is where you plot down all of your points to put onto the graph. Graphics view was where you could see all your points and their letters to specifically see where the points were plotted and seeing if you got any mixture with (x,y). The create polyline tool was mandatory since that is what connected all your points together when it was necessary. Then when you had to show your pictures you had to export them onto your desktop and print them out to be able to have an art piece with them.
Questions:
1. What is a Mathematical Model?
Answer: A mathematical model is a model or art related object made from using math such as we did with GeoGebra. We used Cartesian Planes, line segments, and points to make beautiful work that I found to be impressive
2.How can Complex Imagery be modeled mathematically?
Answer: This question relates a lot to me based on the fact that I had a lot of tiny details, but what I did was leave out the unnecessary details that did make them look better but it was far too much work to handle.
3. How can Productivity software be used for graphing?
Answer: We used Geogebra which made it far easier to plot points and create line segments since they were perfect lines and you could not mess up unless, you plotted the wrong (x,y) points.

|
|
1.Original Image
2. BM #2
2. BM #2
